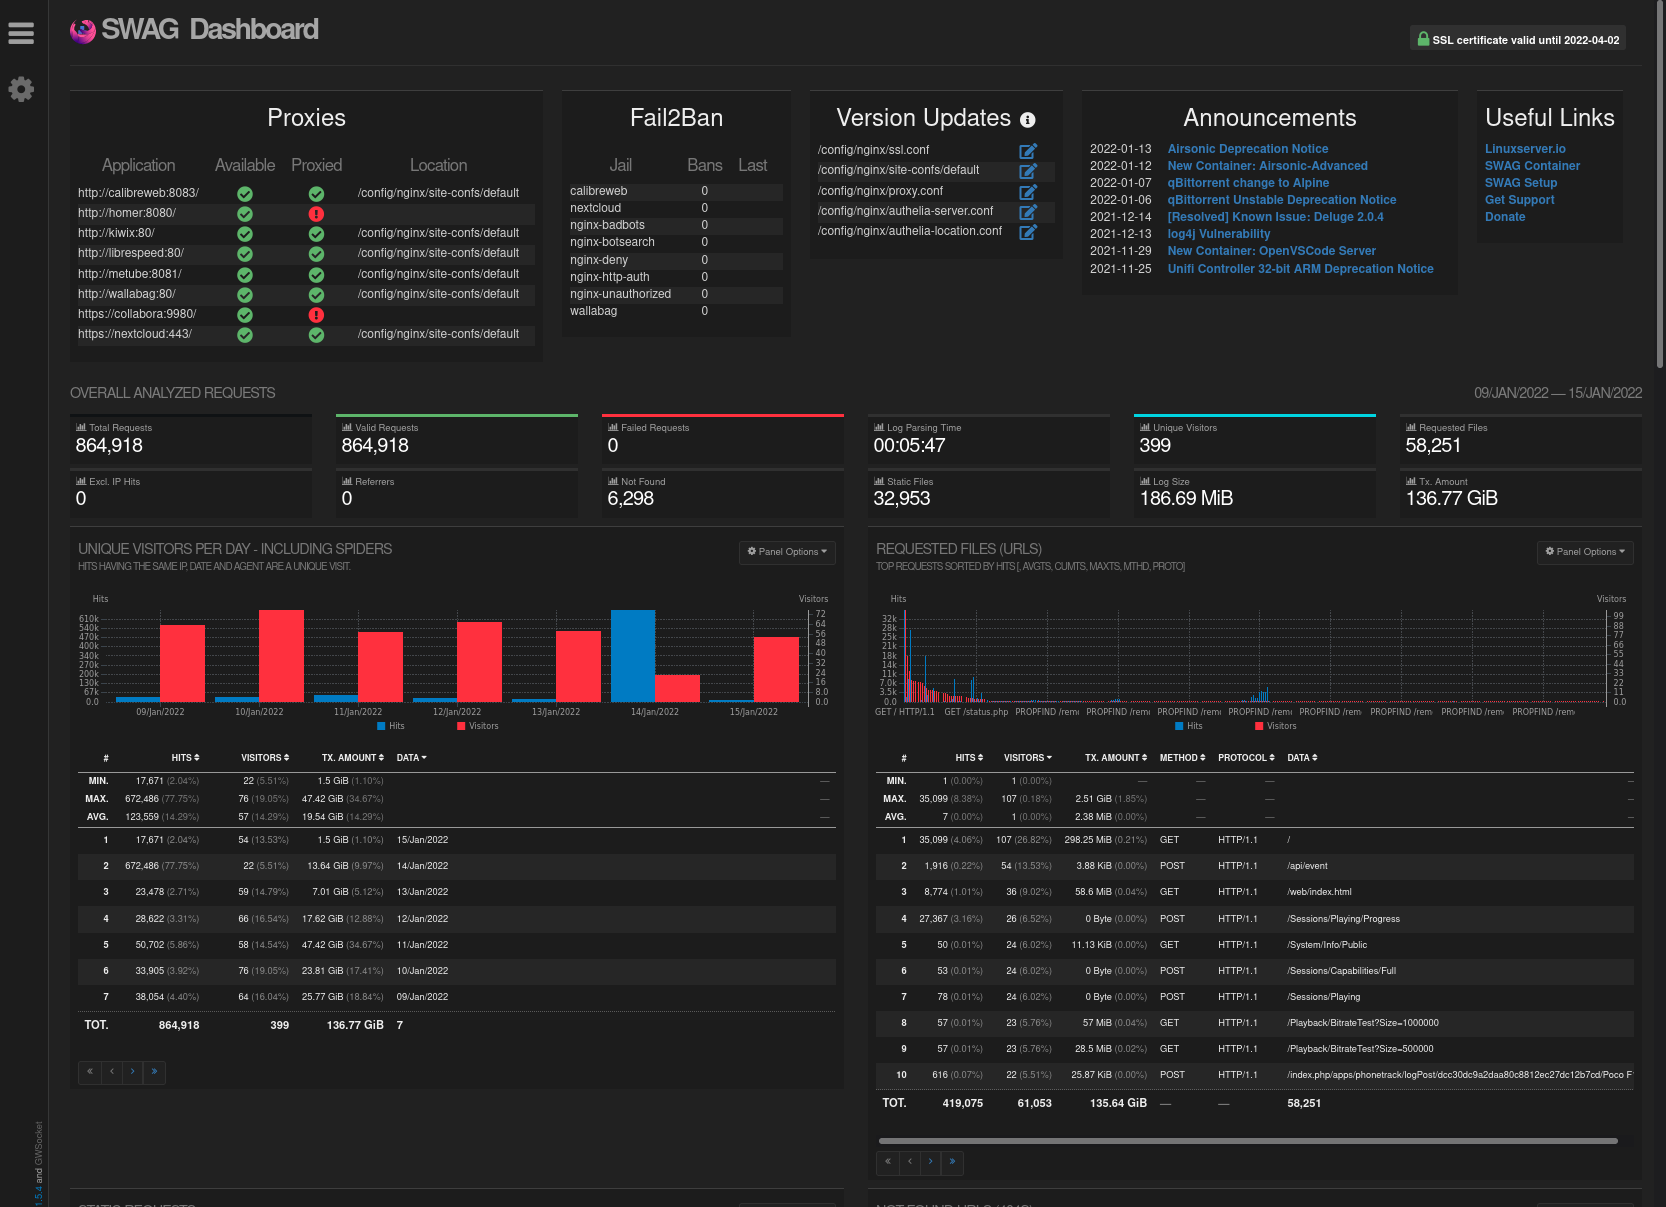
SWAG Dashboard is a mod powered by GoAccess that provides a comprehensive overview of SWAG's operation.
Setup
Follow latest the instructions on the mod's readme to set it up.
Navigate to dashboard.yourdomain.com from your LAN to view the dashboard.
Note that the dashboard only allows LAN access by default, to expose it (on a VPS for example) you would need to remove the allow/deny in /config/nginx/proxy-confs/dashboard.subdomain.conf and instead protect it some other way (like Authelia for example).

Sections
SSL
Shows whether the SSL certificate is valid and when it expires.
Proxies
Searches for available apps on SWAG's network and for proxy configs that have been enabled.
It works best when the proxy confs have a structure that resembles the samples:
  set $upstream_app <container/address>;
  set $upstream_port <port>;
  set $upstream_proto <protocol>;
  proxy_pass $upstream_proto://$upstream_app:$upstream_port;
Fail2ban
Shows active fail2ban jails, amount of bans each jail has, and the last banned IPs.
Version Updates
Shows config files that have version updates and links to the latest versions where you can see the changes.
Announcements
Shows the latest linuxserver.io announcements which include new containers, deprecated containers, and important changes that may concern you.
Graphs
GoAccess is a tool that analyzes the logs and aggregates logged requests into graphs which are useful for finding issues and security concerns.
Unique Visitors Per Day
Shows a breakdown of unique visitors, page hits, and amount of data transferred per day where you can spot concerning amounts of data transfers on specific days.
Requested Files
Shows the most requested URLs, where you can spot concerning amounts of requests being made to specific URLs.
Static Requests
Shows the most requested static files, where you can spot concerting amounts of hits/visitors requesting specific static files.
Not Found URLs
Shows requests to missing URLs, where you can spot concerning amounts of requests to URLs that should not exist.
Visitor Hostnames and IPs
Shows the visitors with the most hits and their country of origin, where you can spot concerning amounts of hits from unknown visitors.
Operating Systems
Shows a breakdown of the operating systems of visitors.
Browsers
Shows a breakdown of the browsers of visitors.
Time Distribution
Shows which time-of-day has the most activity.
Referring Sites
Shows which sites have referred the most, it can be useful for spotting search engines referring to your private domains.
HTTP Status Codes
Shows hits per status code, where you can spot concerning error codes with many hits.
Geo Location
Shows the most active continents and countries, where you can spot concerning amounts of hits from countries which shouldn't access your domains.
Swag Maxmind mod or Swag DBIP mod are required to enable this graph.
